Operational readiness
Viewing the operational readiness dashboard requires ck:ListKits and ck:ListKitsStats. Without these, a 403 Forbidden page is shown.
Click the dashboard icon (grid icon, first item) in the left sidebar to open the Dashboard page, then click the Operational readiness tab.
Average Readiness
Astran AlwaysReady® provides an average "readiness" indicator, calculated as the average readiness of your defined processes. Each process's readiness depends on two factors:
- Status (Draft, Validated, or Simulated), and
- Freshness of associated data (whether data is up to date or not).
A process in Draft status with missing or outdated data will have a low readiness score, while a process in Validated or Simulated status with current data will have a high score.
On the dashboard, you can also view:
- The readiness per category, which is the average readiness score of all processes in that category.
- The readiness over time, which tracks the global readiness trend across a chosen period. You can zoom in on a specific category by clicking that category in the "Readiness by category" chart.
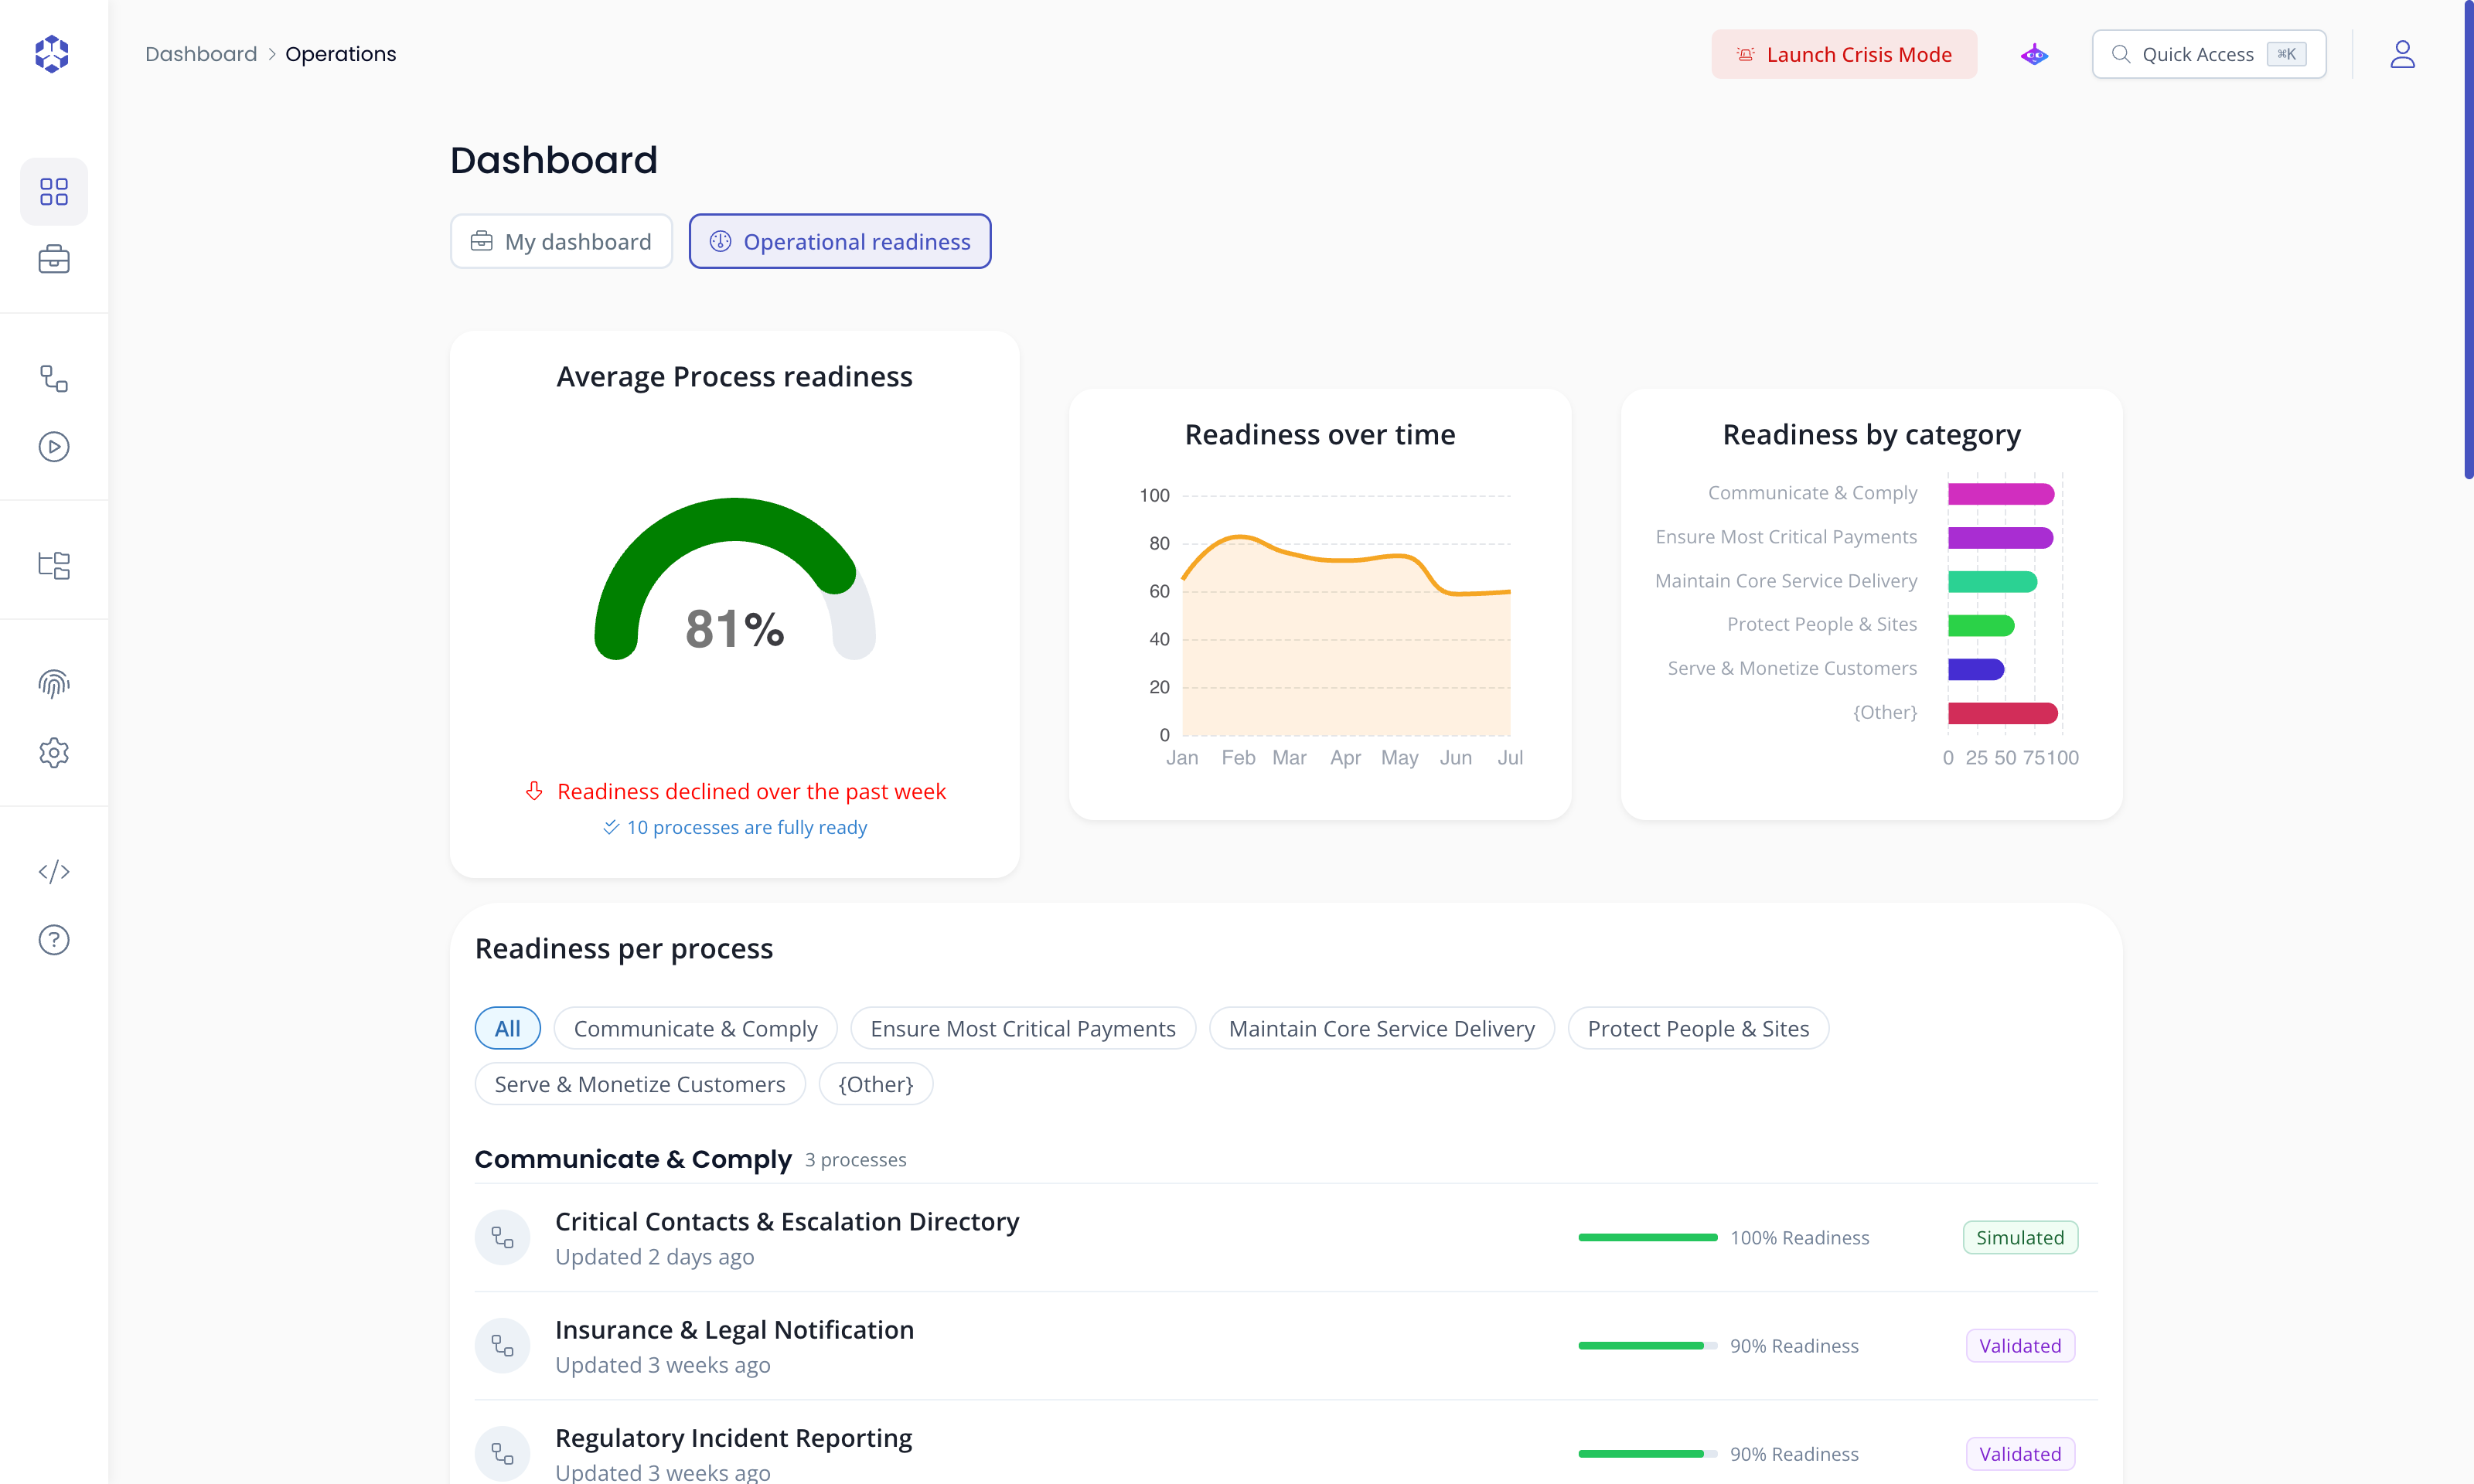 Operational readiness dashboard.
Processes listing
All processes and their statuses are displayed in the dashboard's listing. You can filter by category by clicking on a category in the "Readiness by category" chart.